With the weather playing havoc with potential ringing sessions last week, and projected until Friday of this week, I needed something to fill the time. I decided to have a look at our activity levels in the Braydon Forest and how that reflected in the catching of our commonest small resident species, namely the Paridae: Blue, Great, Coal and Marsh Tits, plus Long-tailed Tit, Robin and Wren.
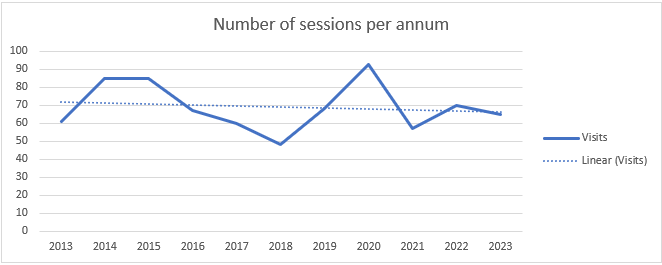
Graph 1: showing visits per annum plus the trend over the period
As you can see from the graph, although there are annual fluctuations in the number of sessions, the overall trend is pretty constant. The initial series of tables and charts show simply the proportion of the total number of catches in which each species is caught:
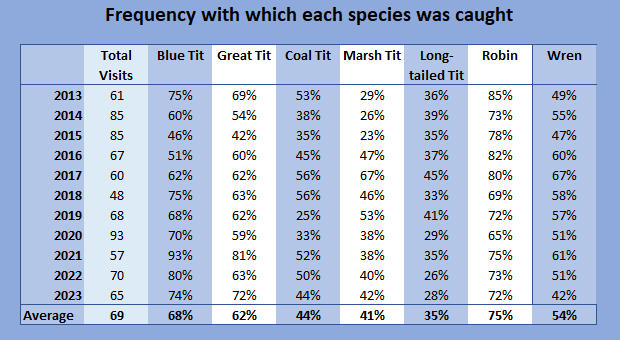
Table 1: Frequency with which each species was caught

Graph 2: Frequency with which each species was caught
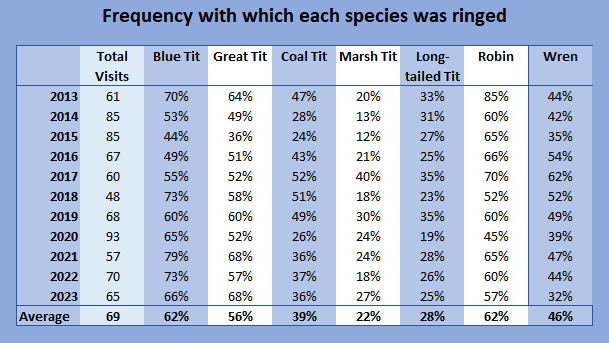
Table 2: Frequency with which each species was ringed

Graph 3: Frequency with which each species was ringed
What do these tell us? Before looking at the data there is a caveat regarding Coal Tit and Marsh Tit. Neither have ever been caught at Blakehill Farm nor has Marsh Tit ever been caught in the village of Purton: it is down to a lack of appropriate habitat. Because of this I have not counted those sessions in the analysis of these two species. What surprised me was that, as per table 1, we actually catch the Robin more frequently than any other species: anecdotally I would have put money on it being Blue Tit. Equally, to find that the frequency with which we ring Robin is the same as the frequency with which we ring Blue Tit is also interesting.
So to actual numbers caught. It is no surprise that the Blue Tit has the largest catch size. When talking about numbers, instead of adding the number of birds ringed to the number of retrapped birds, which gives a false reading because many birds are caught multiple times, I counted the actual number of individual birds processed each year. These are the results:
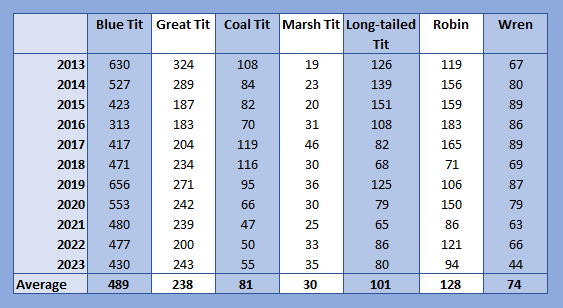
Table 5: Number of individual birds processed by species by year
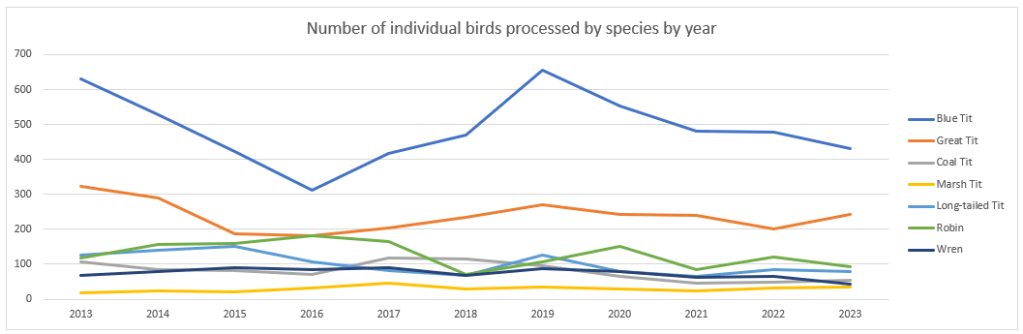
Graph 4: Number of individual birds processed by species by year
So, looking at the bald numbers, Blue Tit is far and away the largest catch, as expected. Unsurprisingly, Marsh Tit is the lowest catch. However, what proportion of each species caught is ringed?
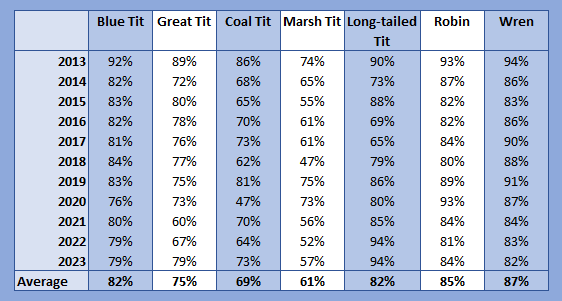
Table 6: Frequency of birds ringed vs total number of individual birds processed by species by year
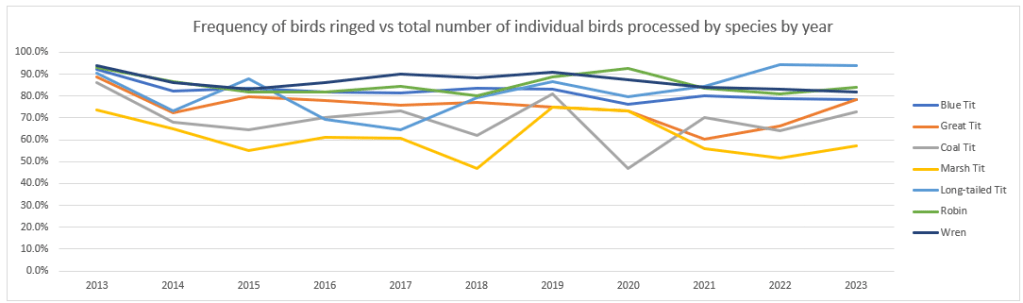
Graph 5: Frequency of birds ringed vs total number of individual birds processed by species by year
As is clear: the number of birds ringed is pretty similar across most species. The two that have the lowest proportion of ringed to caught is the least common species and the one that is slowly declining.
That has passed a few hours and I have found it quite interesting. Certainly the outcomes were not as I expected from gut feelings, based on experience of each session. Hopefully I will have something somewhat more interesting to report on in the next few days.
